Species Details
- Species name
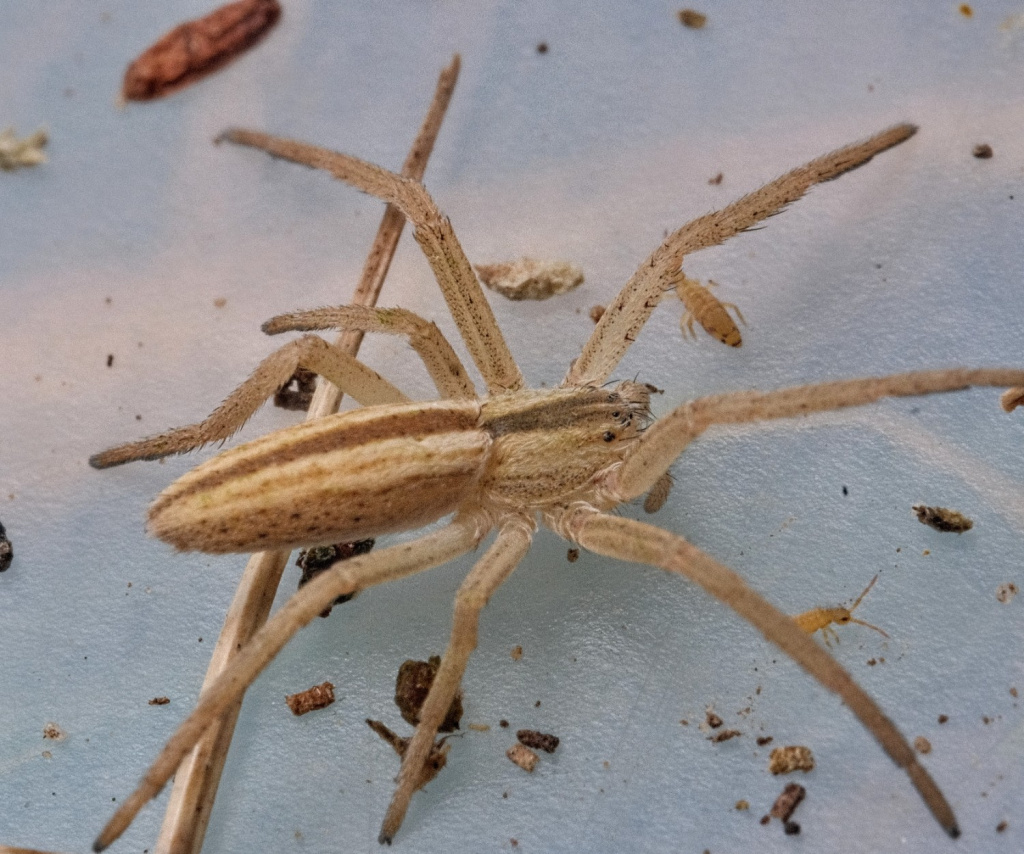
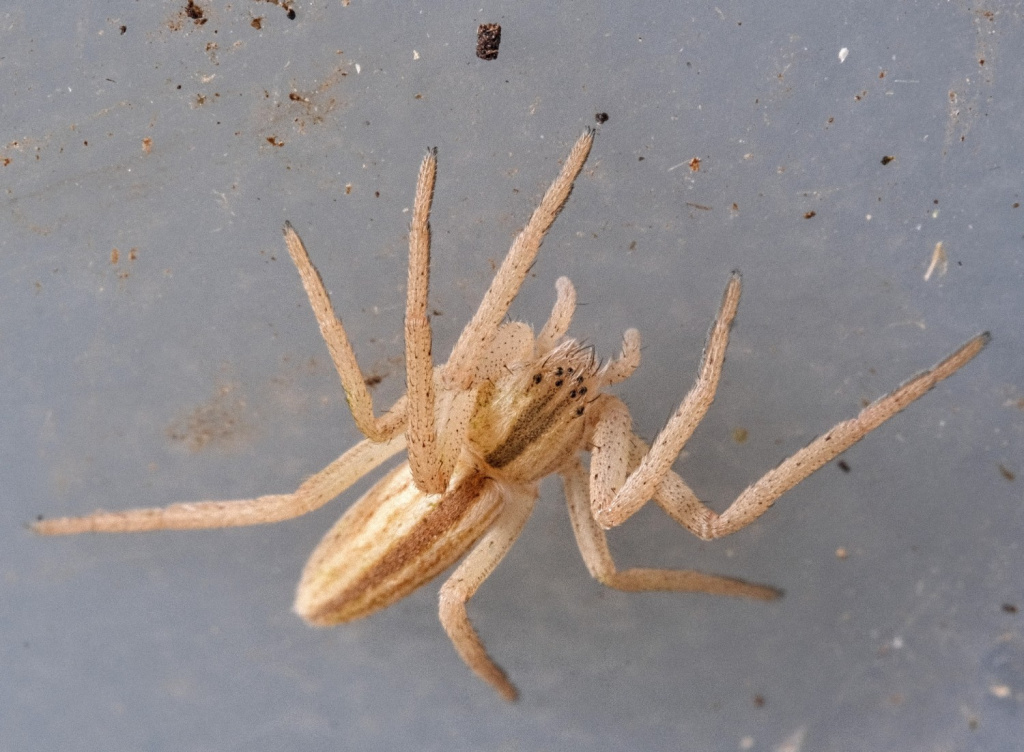
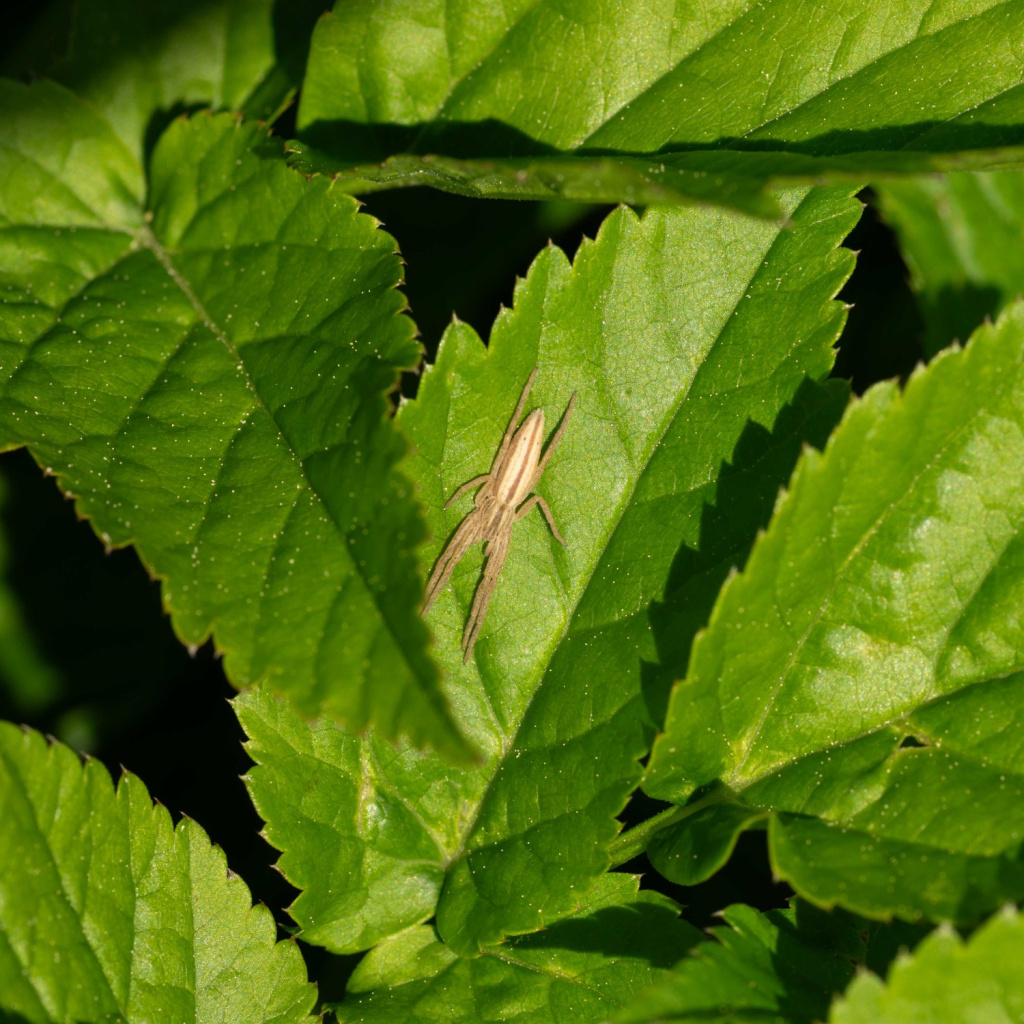
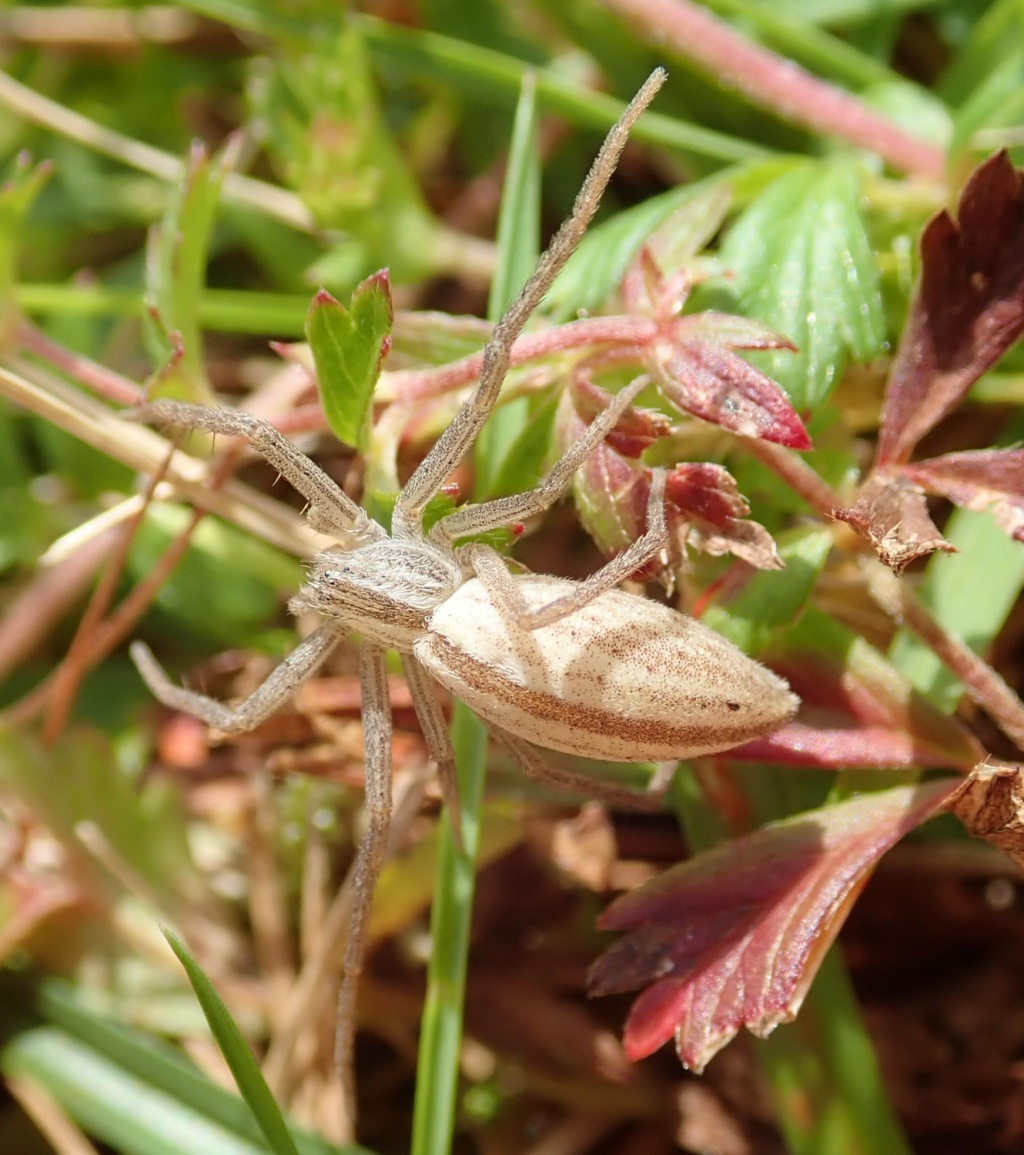
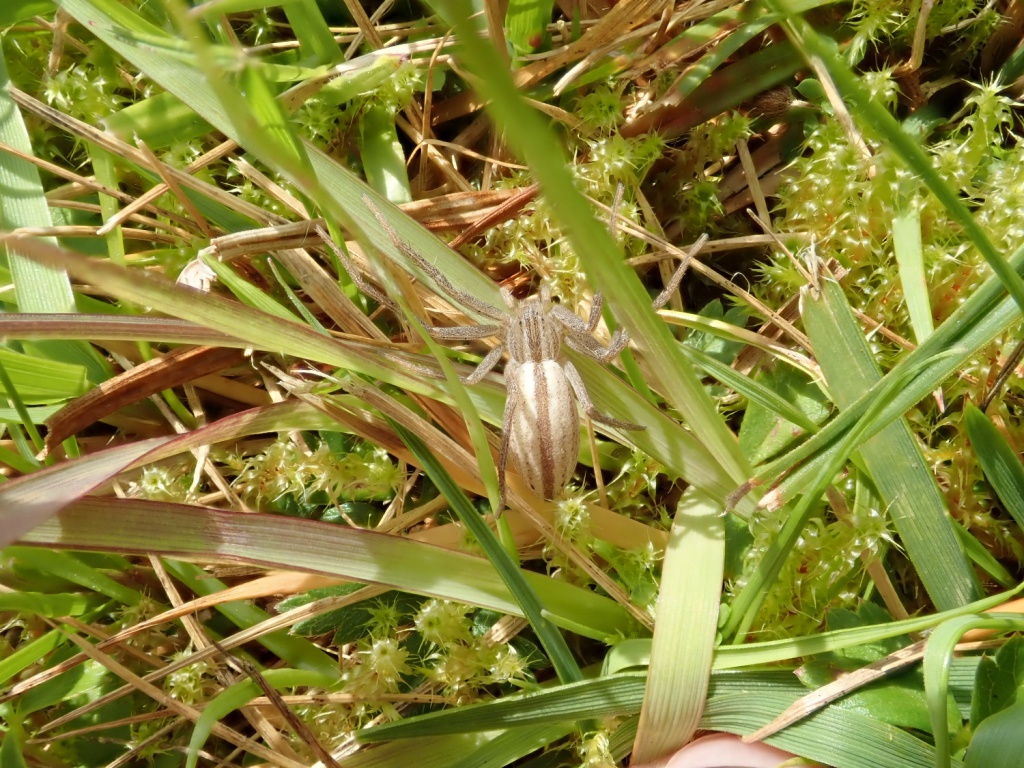
- Tibellus maritimus (Menge, 1875)
- Taxonomy
- Animalia :: Araneae :: Philodromidae
- tall sward & scrub
Distribution
The spider has a scattered Distribution: in much of Britain, but is absent from many areas. A Holarctic species, widespread in western and central Europe.Habitat and ecology
T. maritimus is found on coarse grasses, heather, rushes, etc. in damp places, raised bogs, on sand-hills and rough ground. Specimens are often found hugging plant stems with the legs extended along the length of the stem and in this position they are largely inconspicuous. When disturbed they move very rapidly upwards in the vegetation. Adults of both sexes are found late spring to mid-summer, females persisting later.Status
Although T. maritimus has a much more localised distribution than T. oblongus, it may be locally abundant. In the past there has been some confusion between these two species and they are only separable with certainty by careful examination of the genitalia. Original author of profile: D.R. Nellist Text based on Harvey, P.R., Nellist, D.R. & Telfer, M.G. (eds) 2002. Provisional atlas of British spiders (Arachnida, Araneae), Volumes 1 & 2. Huntingdon: Biological Records Centre.Stats
- First recorded
- 1900
- Last recorded
- 2025
- Total records
- 744
- Total visits
- 737
Conservation status
Tibellus maritimus
| Source | Reporting category | Designation | Date designated | Comments |
|---|---|---|---|---|
| A Review of the scarce and threatened spiders (Araneae) of Great Britain: Species Status No. 22 (Sep 2017) | Red listing based on 2001 IUCN guidelines | Least concern | 42979 |
Photos and media

Spatial distribution - hectad map
Click on one of the date ranges in the key to highlight that particular range. Click anywhere else on the map to go back to all three date ranges.
Thresholds:
Move mouse cursor over dot for info
Rejected records are excluded from this map. Unverified records are included.
Temporal distribution - records by year
Records that span more than one year are not included in this chart.
Temporal distribution - records by week
__