Species Details
- Species name
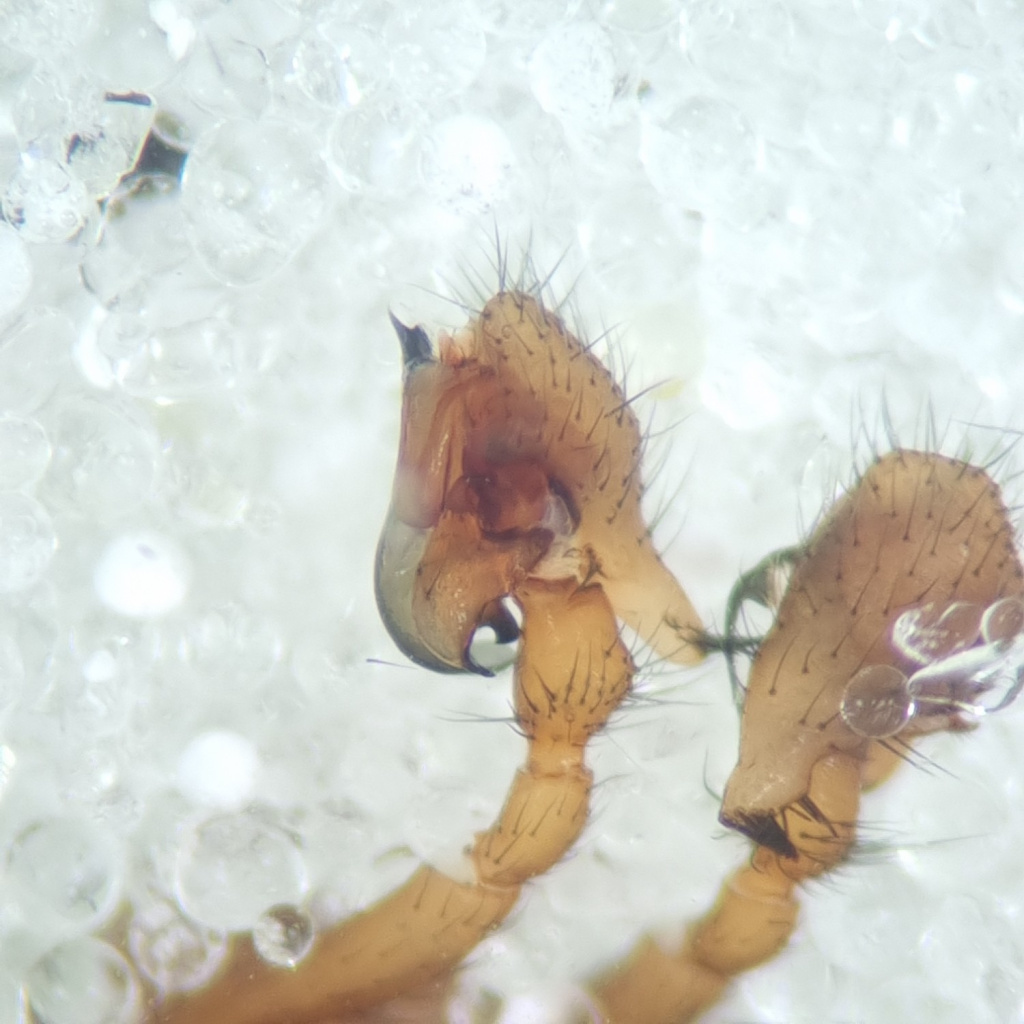
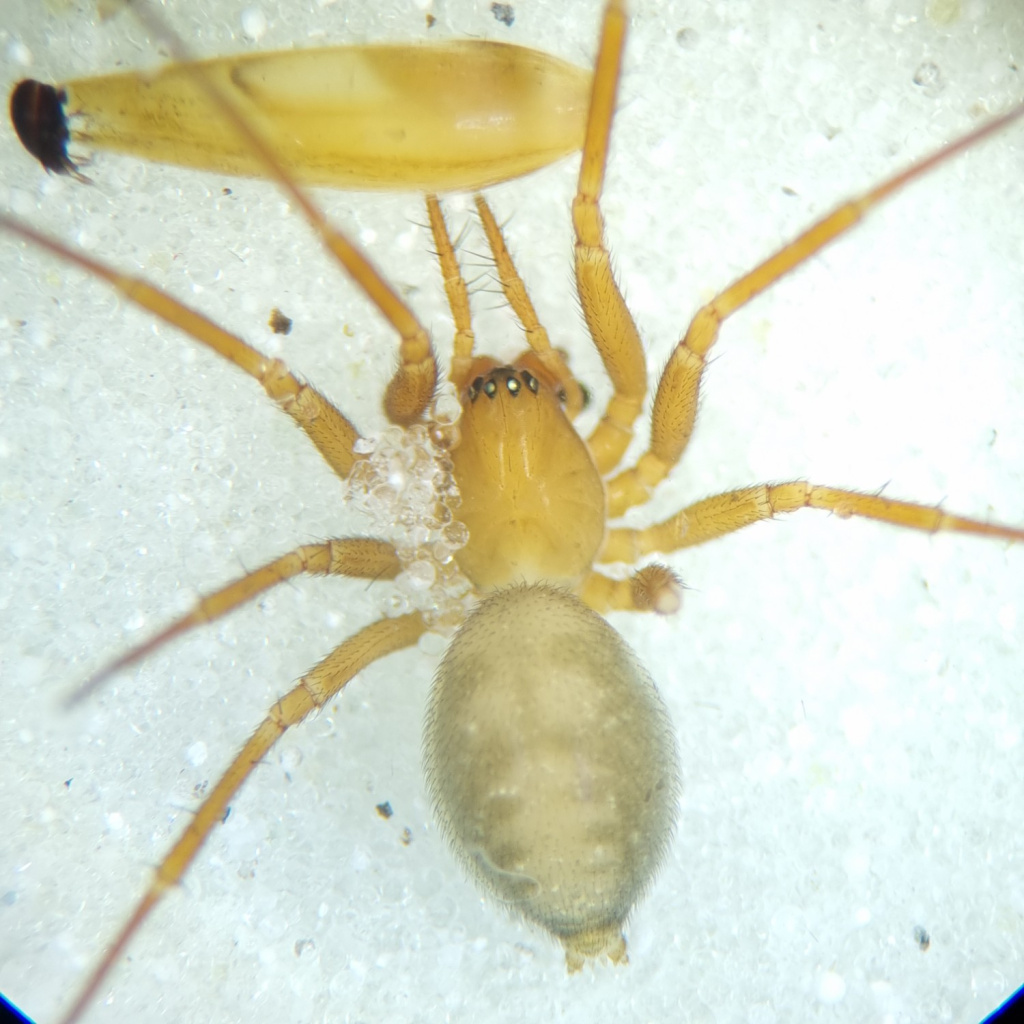
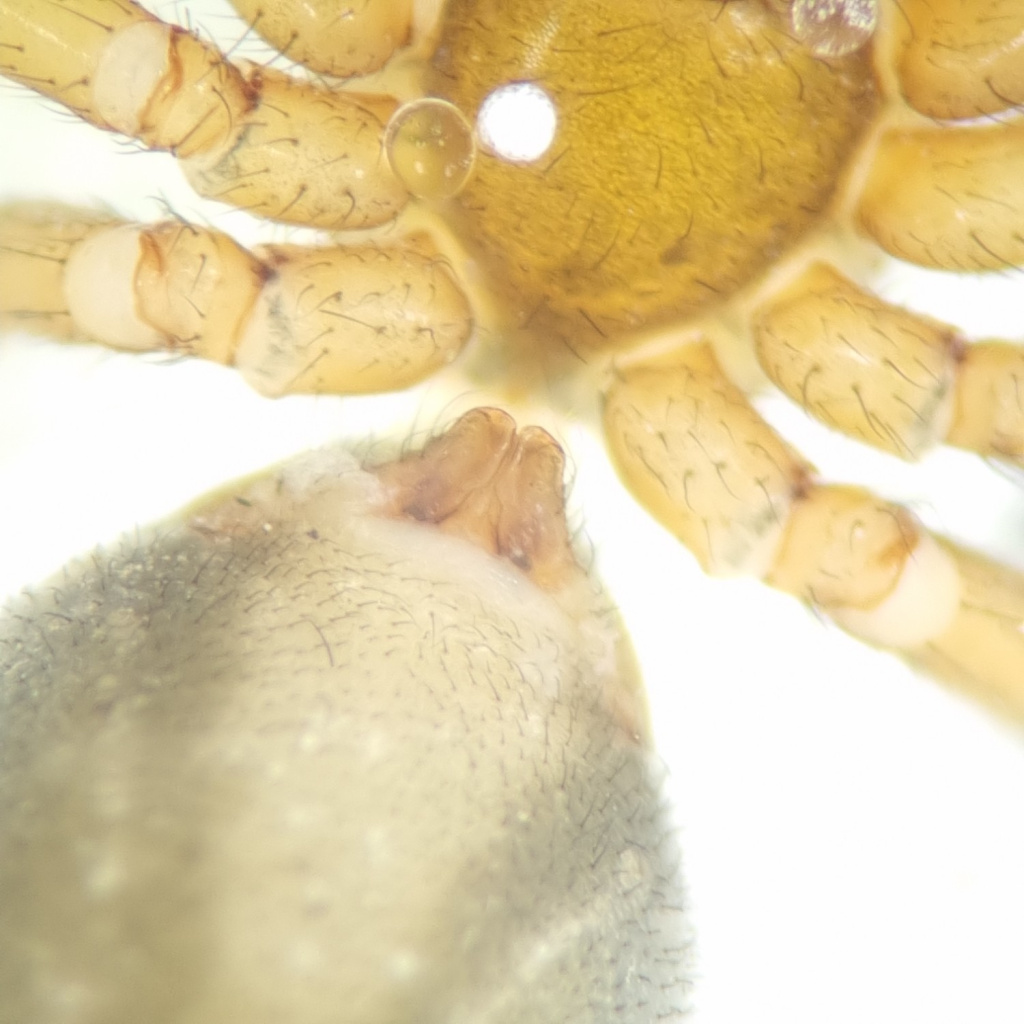
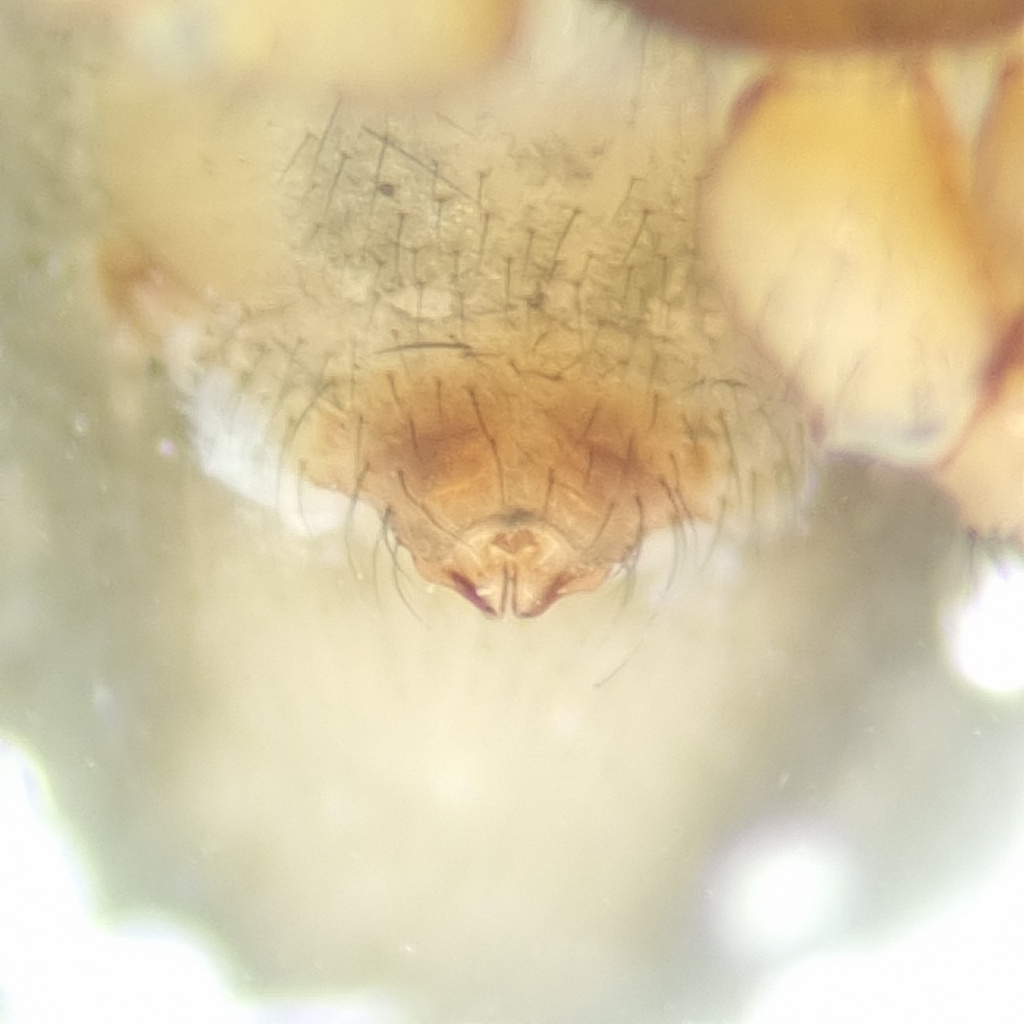
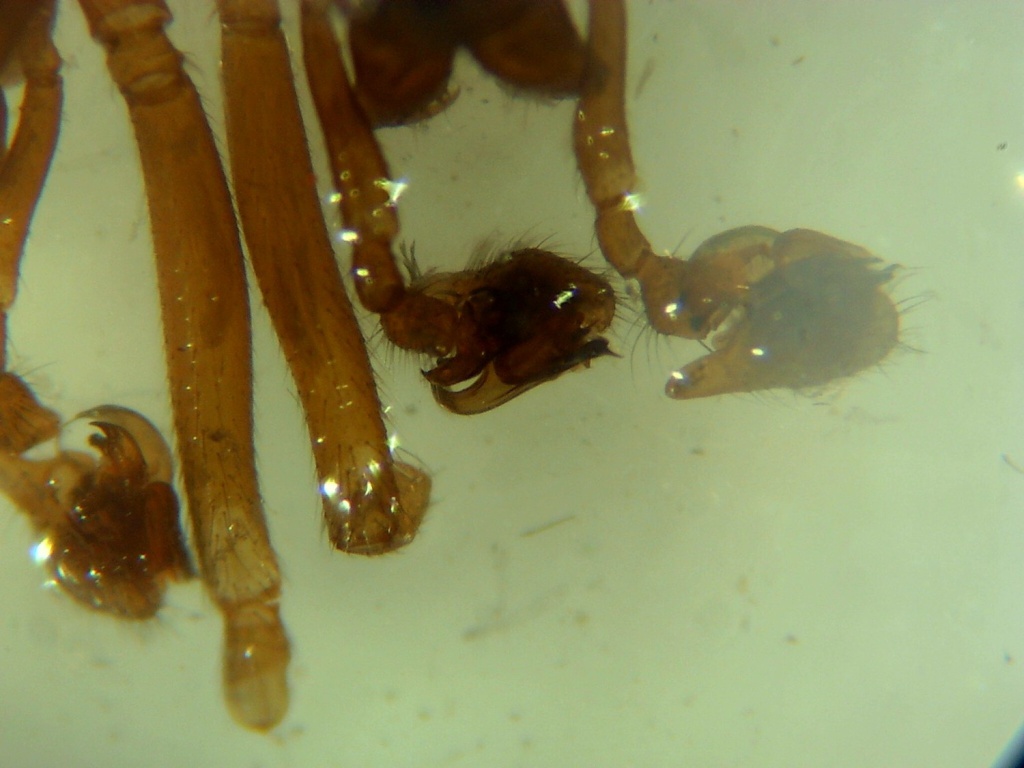
- Allomengea vidua (L. Koch, 1879)
- Synonyms
- Allomengea probabilis (O.P.-Cambridge, 1908), Mengea warburtoni (O.P.-Cambridge, 1889), Allomengea warburtoni (O.P.-Cambridge, 1889), Allomengea vidua (L. Koch, 1877)
- Taxonomy
- Animalia :: Araneae :: Linyphiidae
- acid & sedge peats
Distribution
The species is widespread in Wales and much of England, mainly north of the Severn-Thames, with a concentration in East Anglia, and scattered records as far north as central Scotland. It is widespread in north-western and central Europe.Habitat and ecology
Found in a variety of usually wet habitats such as swamp, fen and marsh, mostly at low altitudes. Adults of both sexes are found in late summer and autumn.Status
The species is very local, and appears to have suffered major decline. Trend analysis of the continuing decline in area of occupancy over the period 1976 to 2005 indicates a reduction in population size of 40% over a ten year period. However, Wales and the wetlands of eastern England are both relatively less well recorded in recent years.Threats
Drainage of wetland sites for agriculture and forestry.Management and conservation
Maintain hydrological regime in wetlands where it occurs. Text based on Dawson, I.K., Harvey, P.R., Merrett, P. & Russell-Smith, A.R. (in prep.).Stats
- First recorded
- 1900
- Last recorded
- 2025
- Total records
- 814
- Total visits
- 792
Conservation status
Allomengea vidua
| Source | Reporting category | Designation | Date designated | Comments |
|---|---|---|---|---|
| A Review of the scarce and threatened spiders (Araneae) of Great Britain: Species Status No. 22 (Sep 2017) | Rare and scarce species | Nationally Scarce. Includes Red Listed taxa | 01/09/2017 | |
| A Review of the scarce and threatened spiders (Araneae) of Great Britain: Species Status No. 22 (Sep 2017) | Red listing based on 2001 IUCN guidelines | Least concern | 01/09/2017 | Threats: Drainage of wetland sites for agriculture and forestry. |
Photos and media


Spatial distribution - hectad map
Click on one of the date ranges in the key to highlight that particular range. Click anywhere else on the map to go back to all three date ranges.
Thresholds:
Move mouse cursor over dot for info
Rejected records are excluded from this map. Unverified records are included.
Temporal distribution - records by year
Records that span more than one year are not included in this chart.
Temporal distribution - records by week
__