Species Details
- Species name
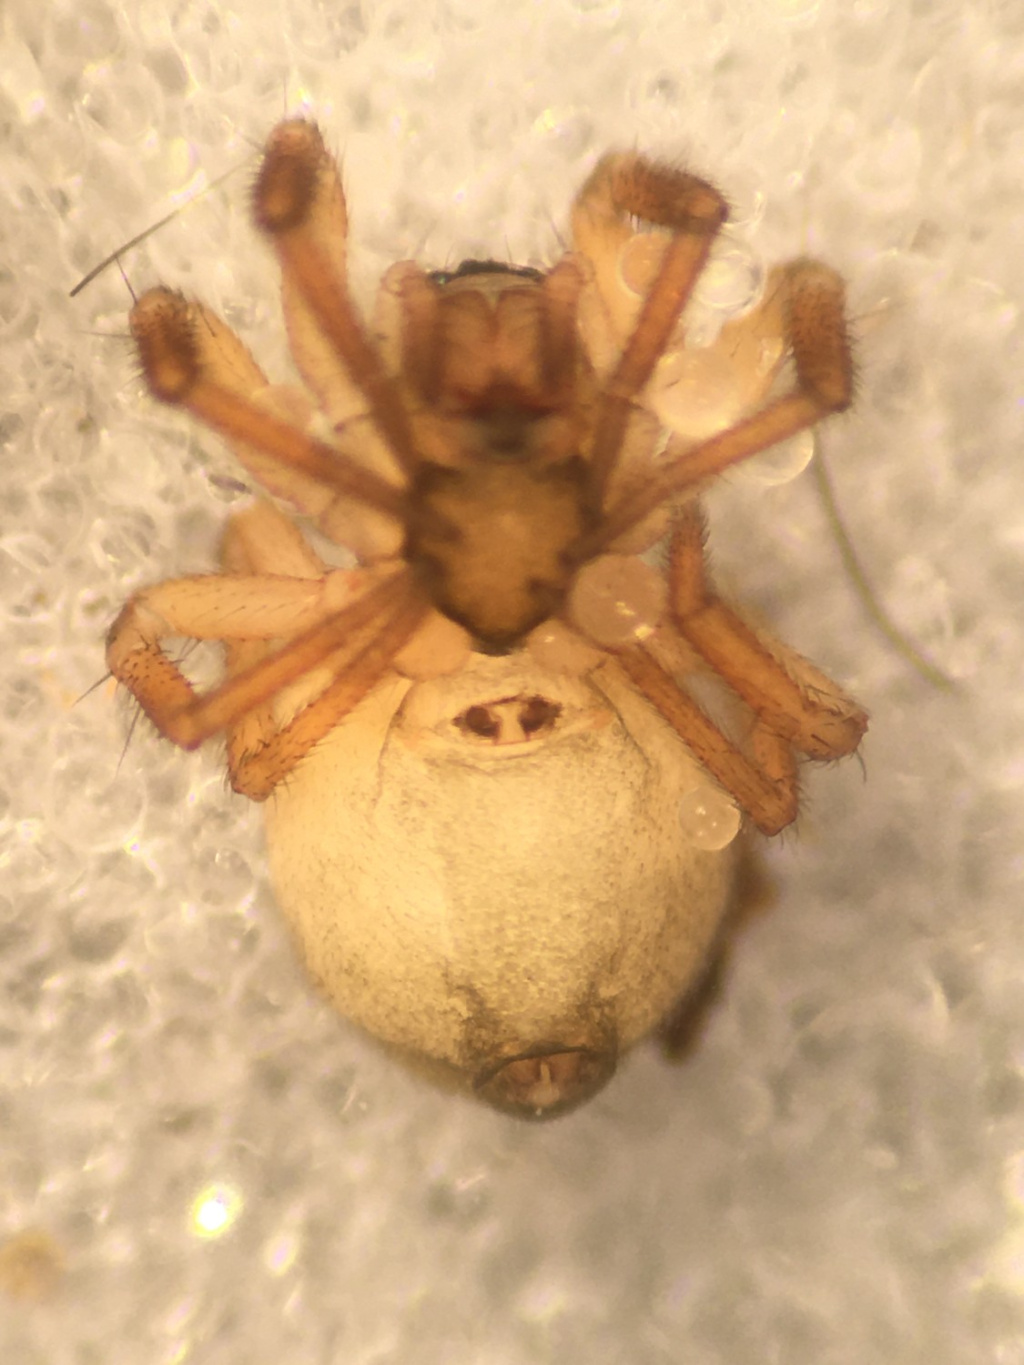
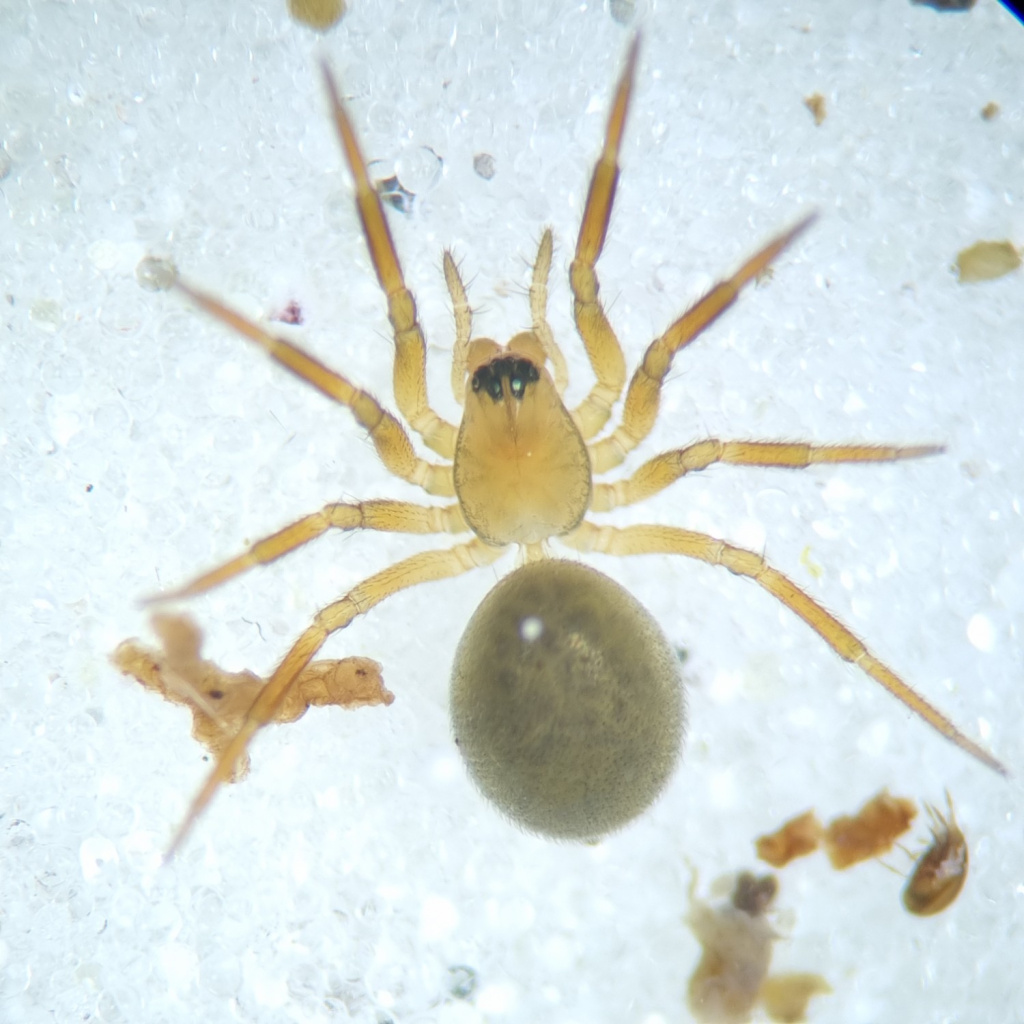
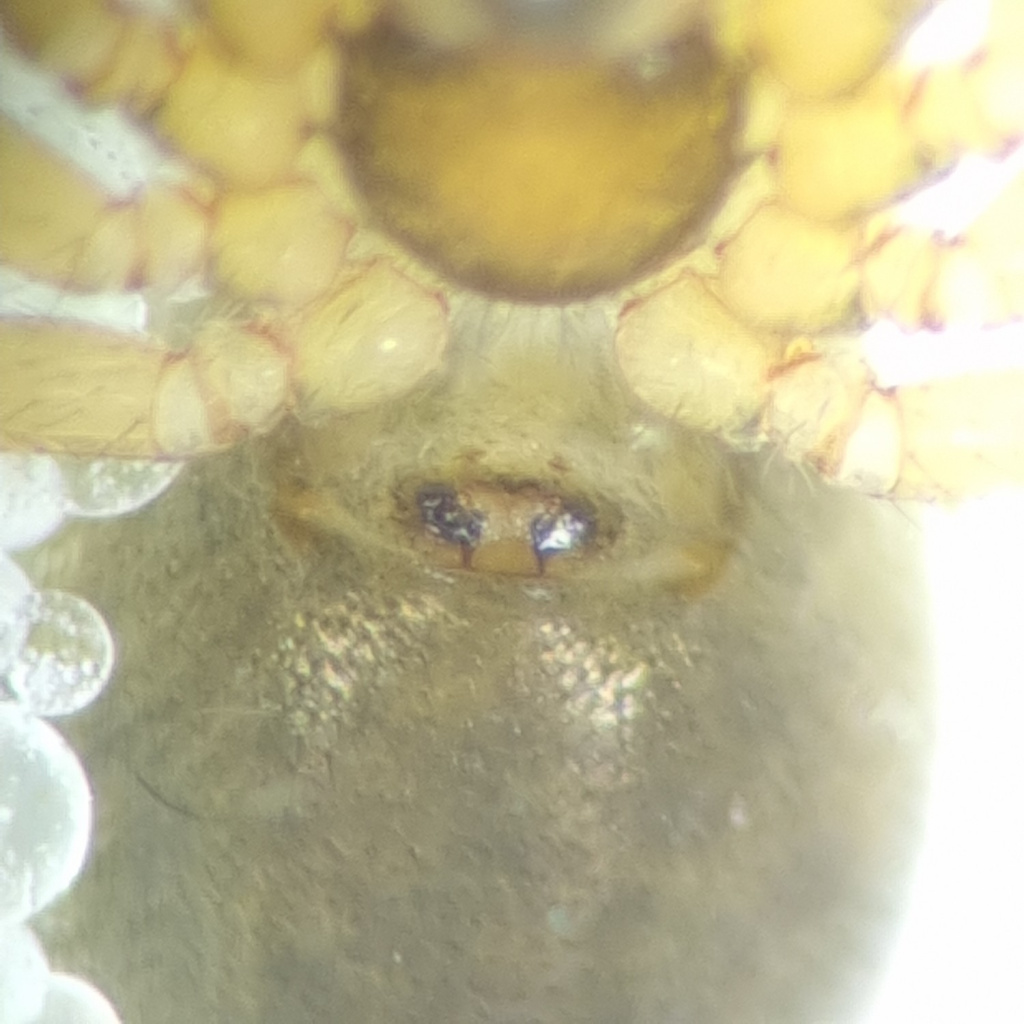
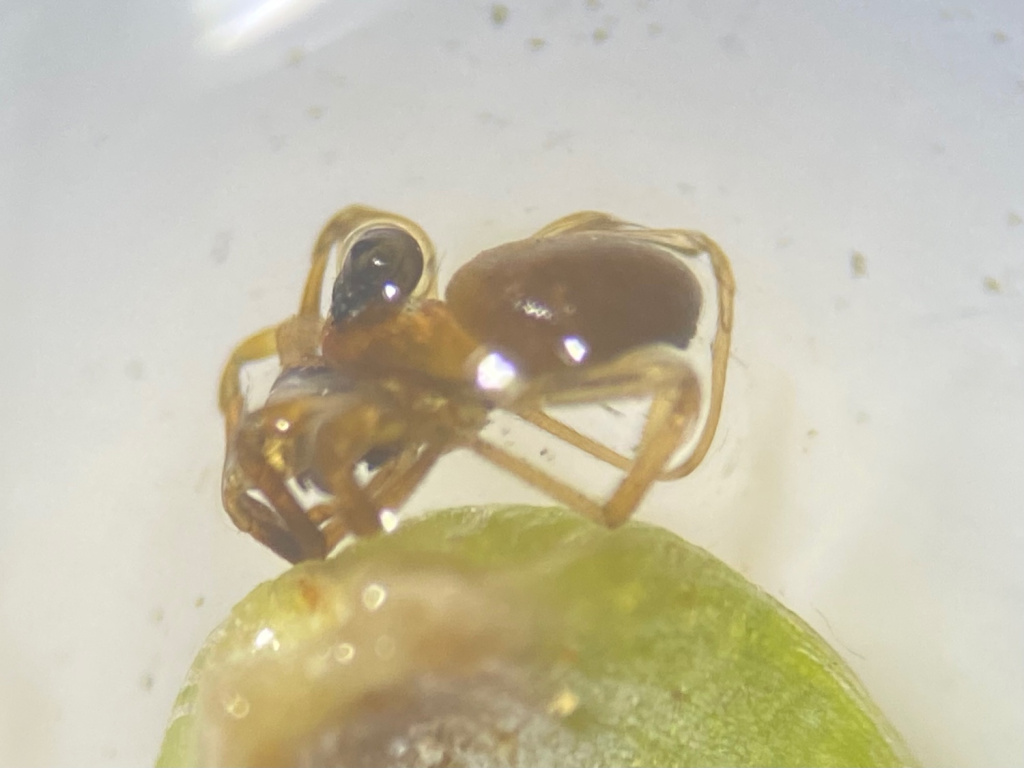
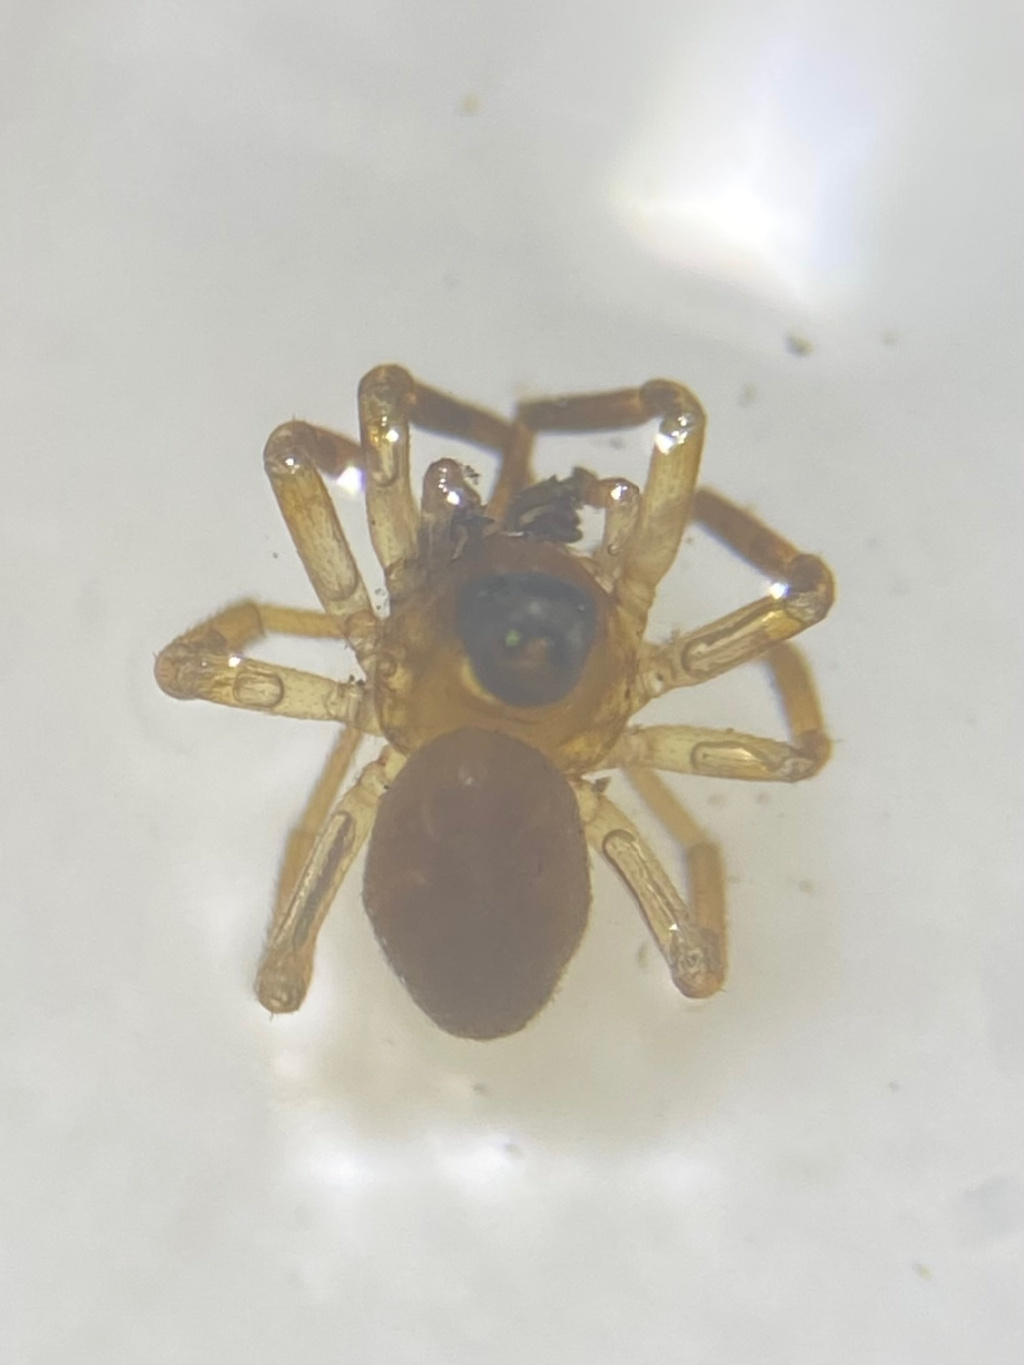
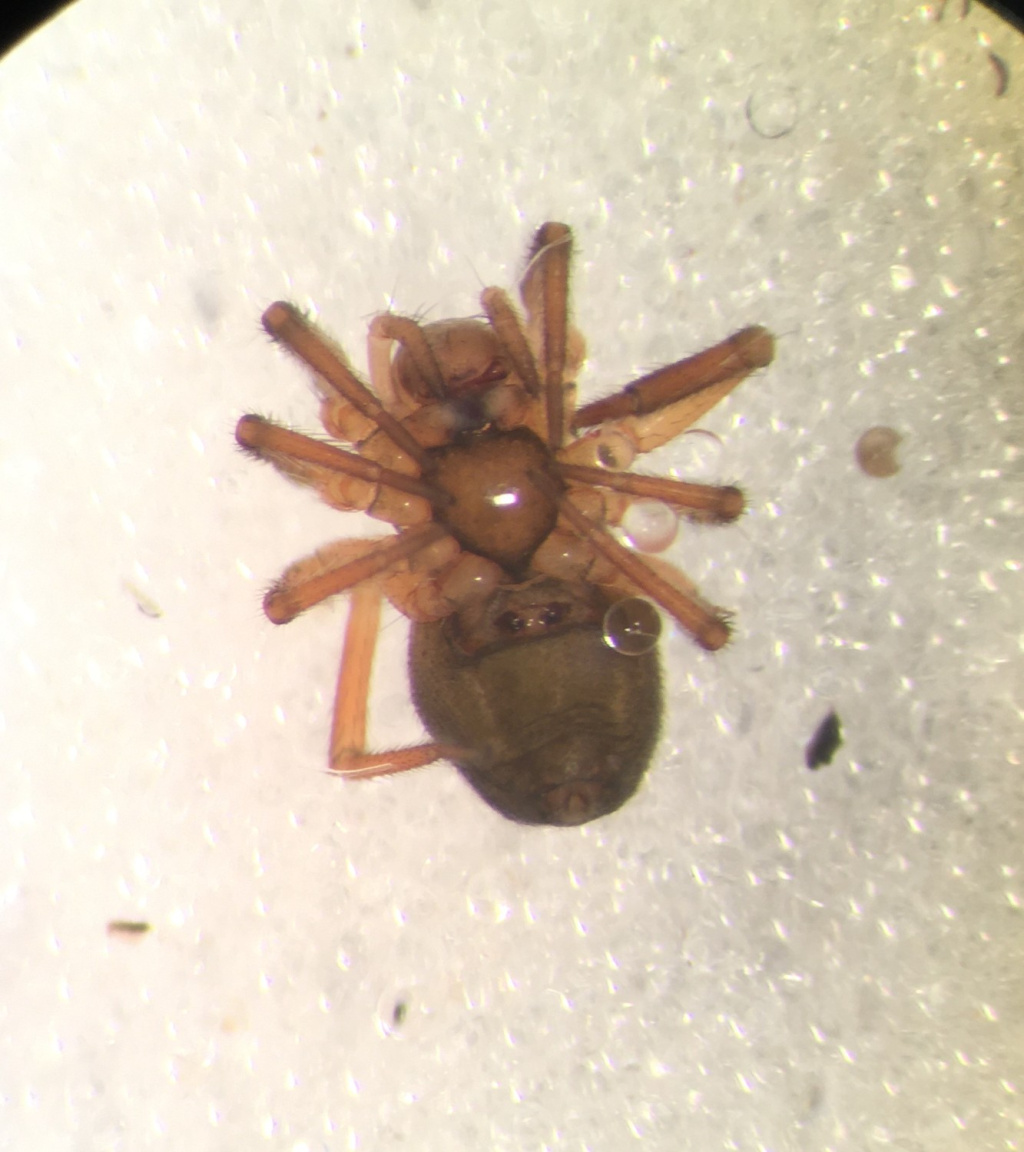
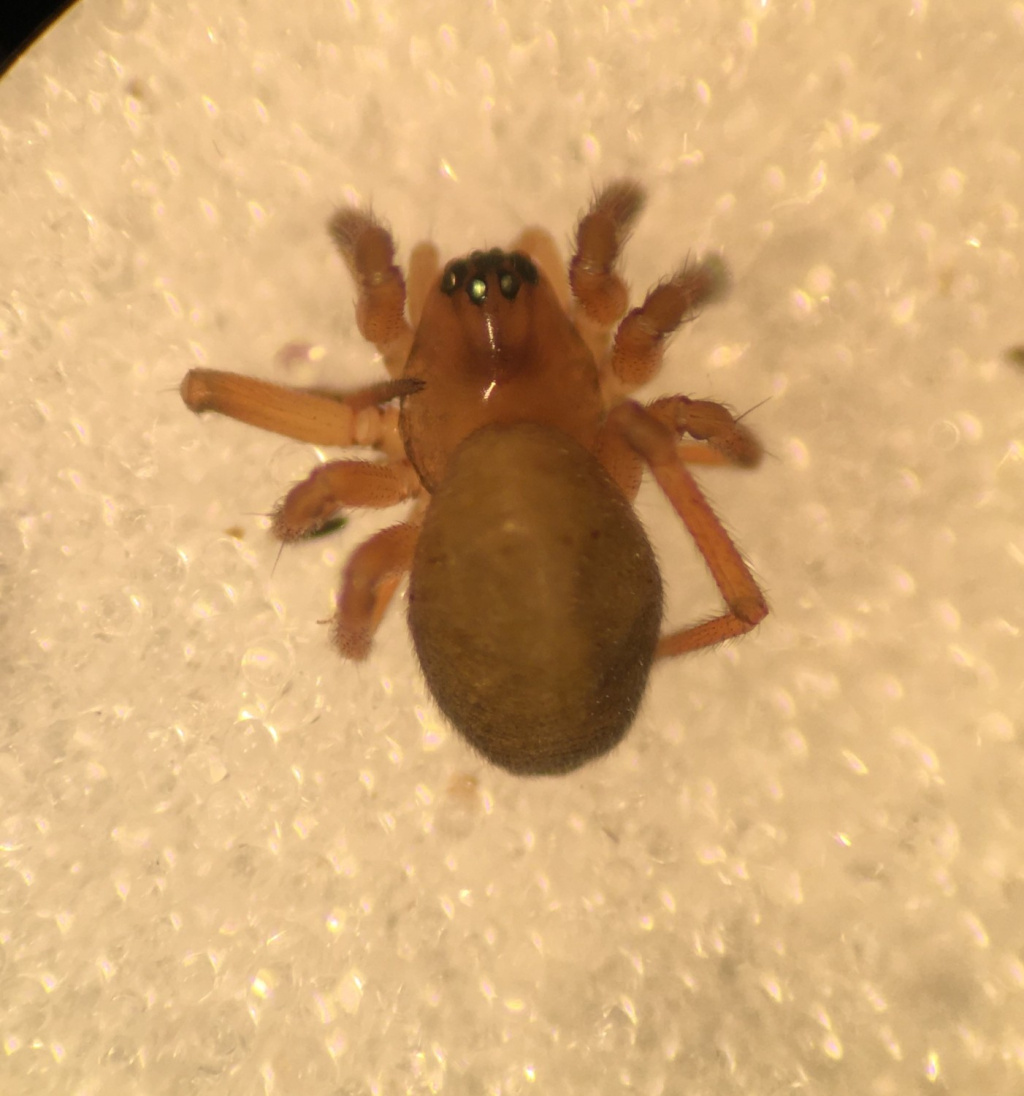
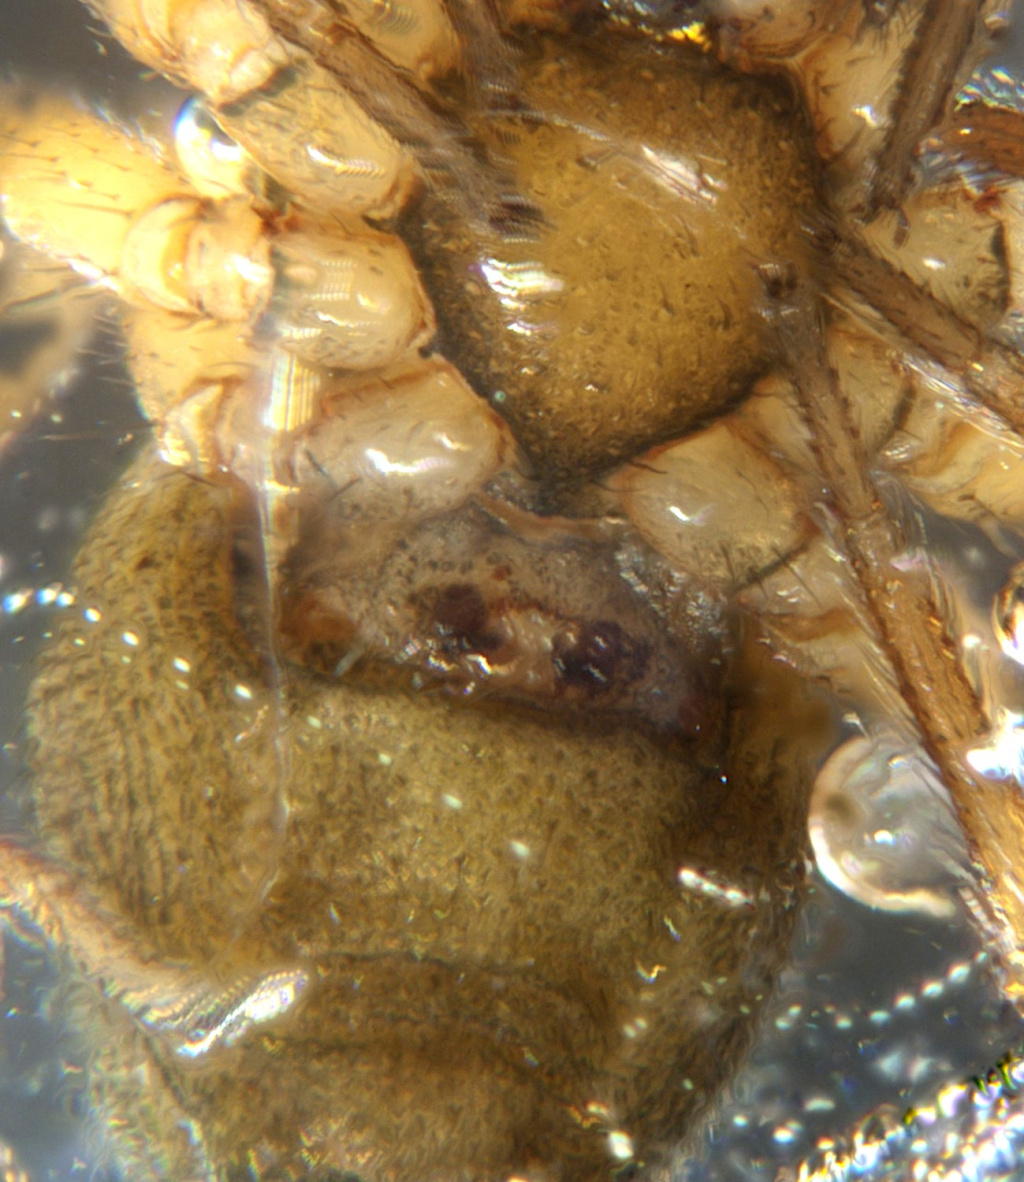
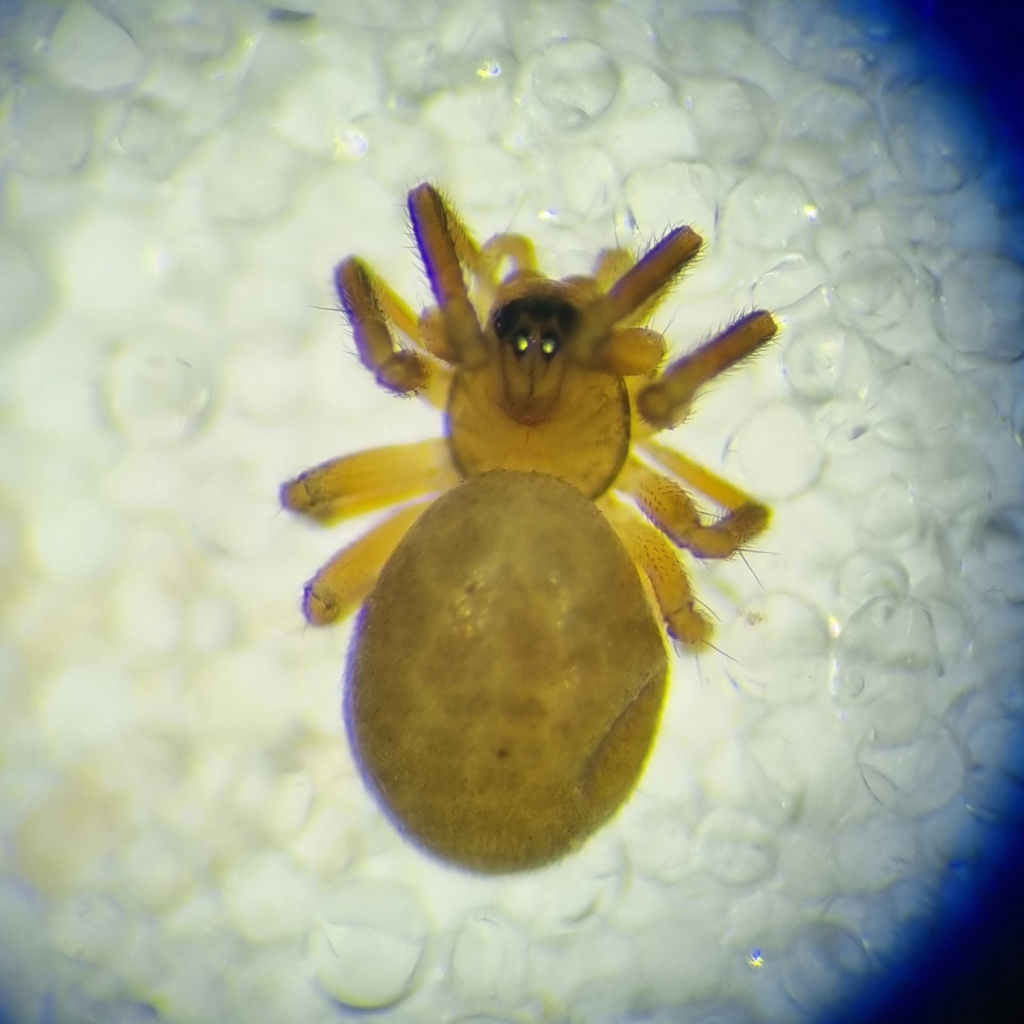
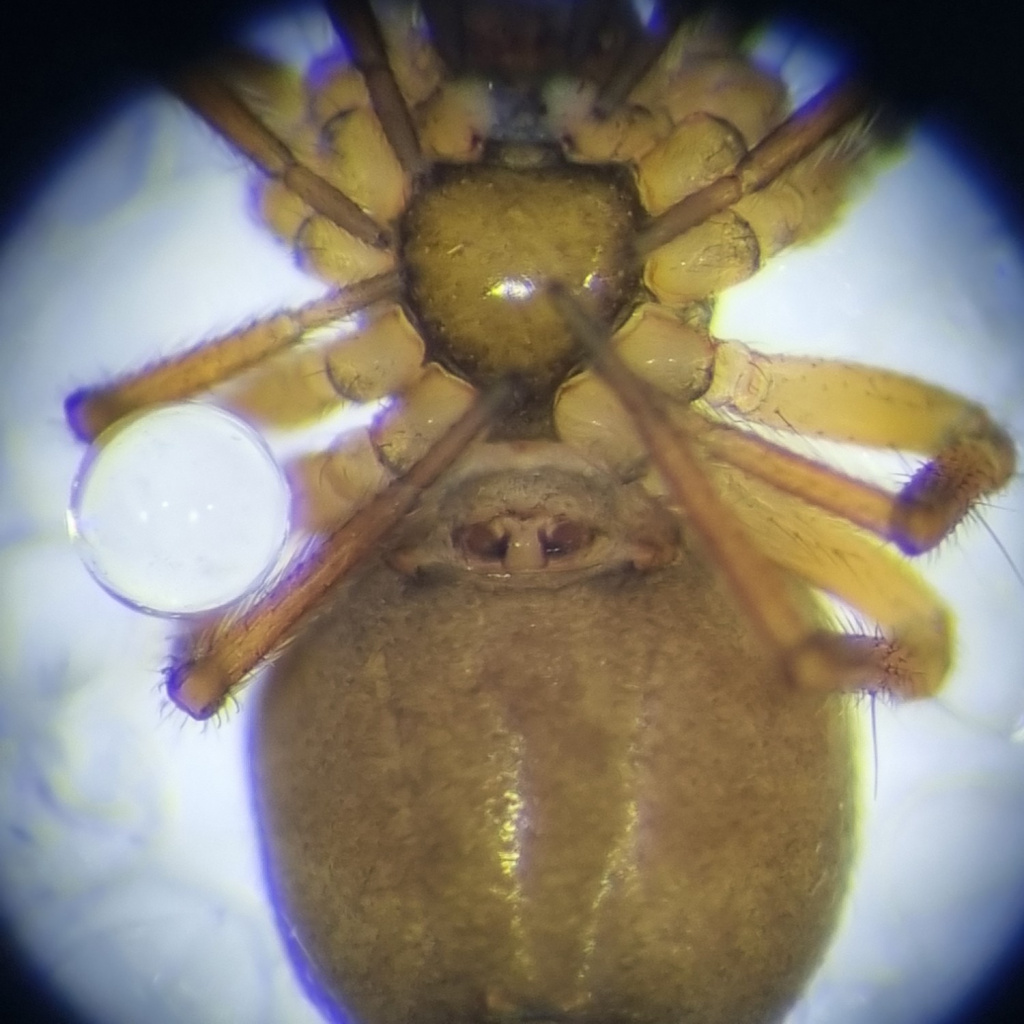
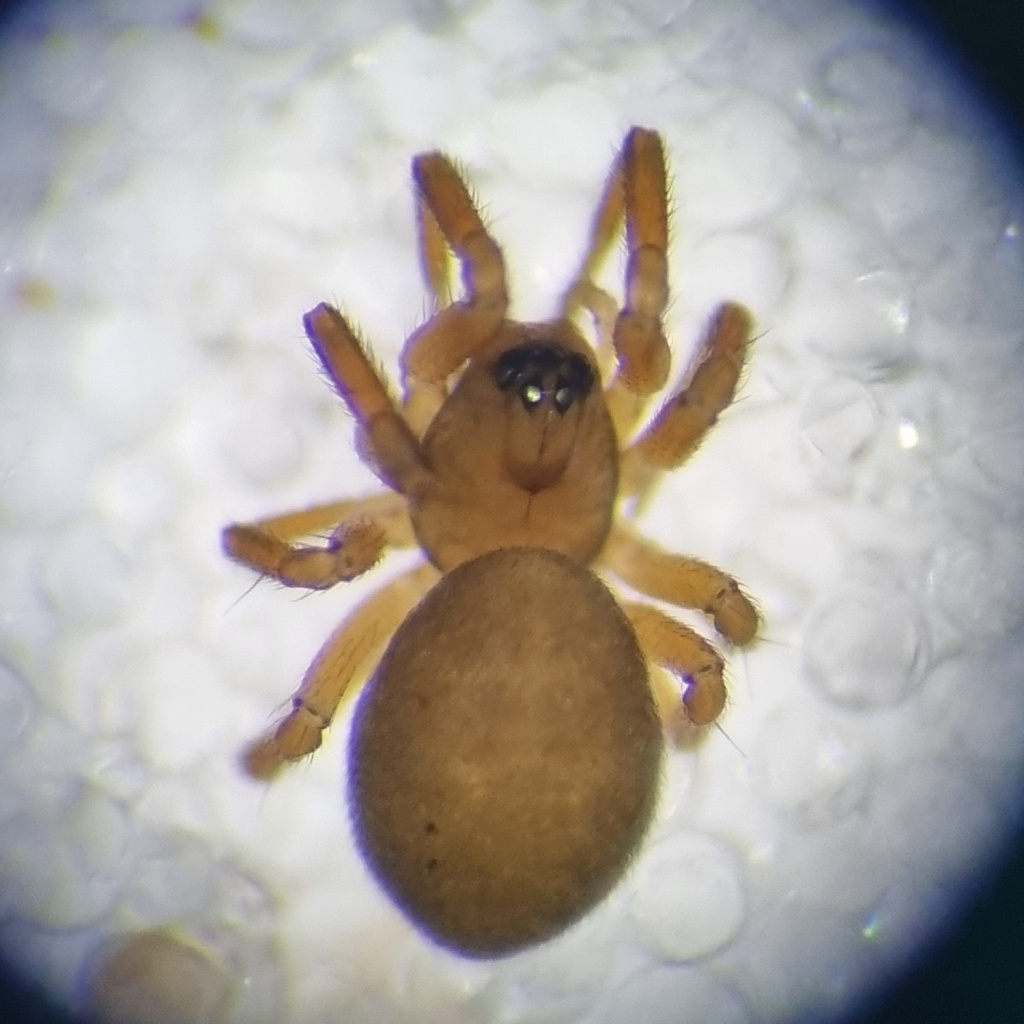
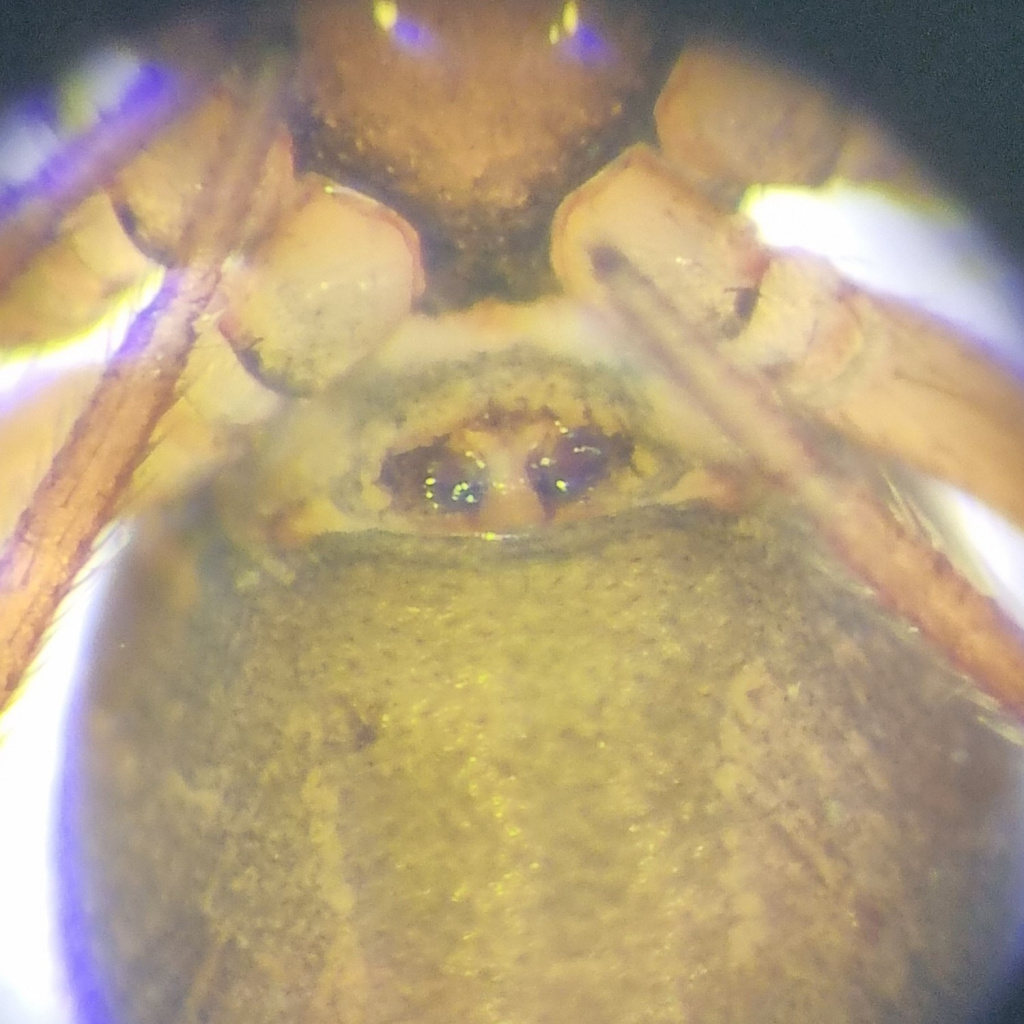
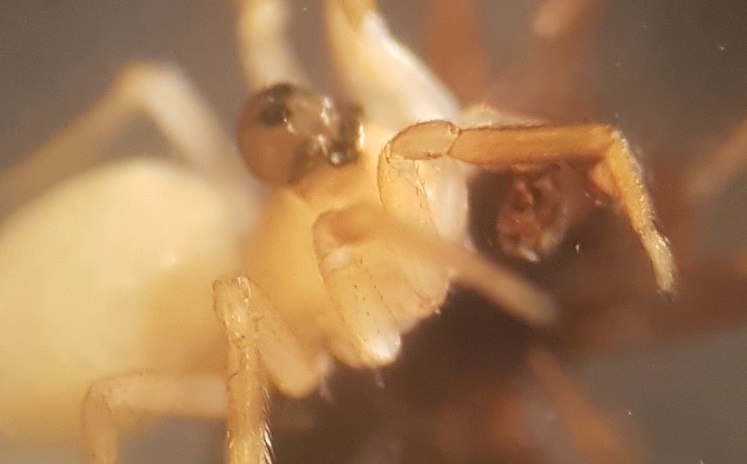
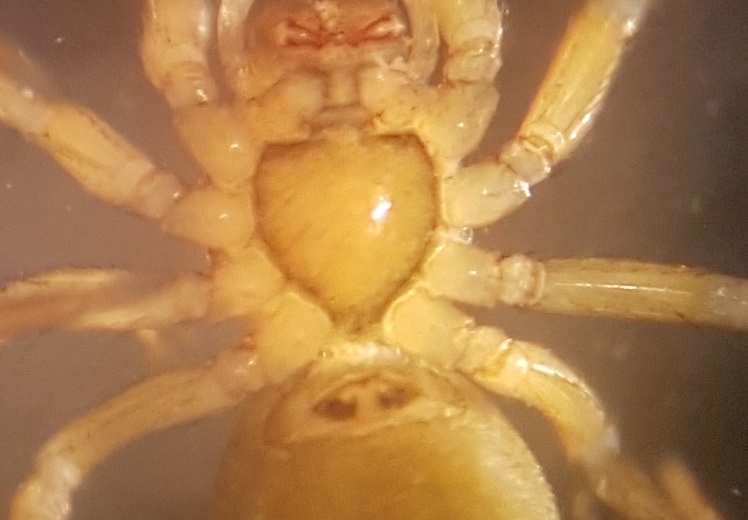
- Peponocranium ludicrum (O.P.-Cambridge, 1861)
- Synonym
- Peponocranium ludicra
- Taxonomy
- Animalia :: Araneae :: Linyphiidae
- tall sward & scrub
Distribution
The species is widespread in much of Britain, but scarce or absent from some areas. It is widespread in north-western Europe.Habitat and ecology
This species is usually found on unimproved grassland and mature heathland. It can be found on tall grass, heather and gorse, but may also occur abundantly in sparsely vegetated sandy habitats. In West Lancashire it is most frequent at middle altitudes (100 - 250 m) but has been found at 400 m (J. Newton, pers. comm.). P. ludicrum builds a small sheet-web amongst vegetation, normally close to the ground. Adult males are active between April and July with a defined peak in May (Merrett 1969), but maybe later further north. Our data show a peak in recorded adults between April and July, females later than males.Status
Locally frequent in suitable habitats. Original author of profile: J.R. Bell Text based on Harvey, P.R., Nellist, D.R. & Telfer, M.G. (eds) 2002. Provisional atlas of British spiders (Arachnida, Araneae), Volumes 1 & 2. Huntingdon: Biological Records Centre.Stats
- First recorded
- 1875
- Last recorded
- 2025
- Total records
- 3,958
- Total visits
- 3,808
Conservation status
Peponocranium ludicrum
| Source | Reporting category | Designation | Date designated | Comments |
|---|---|---|---|---|
| A Review of the scarce and threatened spiders (Araneae) of Great Britain: Species Status No. 22 (Sep 2017) | Red listing based on 2001 IUCN guidelines | Least concern | 42979 |
Photos and media
Spatial distribution - hectad map
Click on one of the date ranges in the key to highlight that particular range. Click anywhere else on the map to go back to all three date ranges.
Thresholds:
Move mouse cursor over dot for info
Rejected records are excluded from this map. Unverified records are included.
Temporal distribution - records by year
Records that span more than one year are not included in this chart.
Temporal distribution - records by week
__